Recruitment analytics turns hiring data into clear insights that reduce time-to-hire, improve quality of hire, cut costs, and expose bias. This guide explains key metrics, dashboards, and how AI simplifies data-driven recruiting decisions for modern, fast-growing teams across industries today.


TL;DR
- Recruitment analytics replaces gut-feel hiring with data-driven decisions.
- Tracking time, quality, cost, diversity, and candidate experience reveals what’s working and what’s broken.
- Dashboards should be real-time, visual, and tailored to recruiters, managers, and executives.
- AI automates data collection, detects bias, and surfaces insights instantly.
- Start with a few core metrics, prove value quickly, and expand over time.
Table of Contents
Last week, I sat down with a VP of Talent Acquisition at a fast-growing tech company. She was frustrated. “We’re hiring like crazy,” she said, “but I have no idea if we’re doing it well. My CEO keeps asking me questions I can’t answer. How long does it really take us to hire? Which job boards actually work? Are we losing good candidates somewhere in our process?”
She isn’t alone. Most recruitment teams still make critical hiring decisions based on gut feeling rather than reliable data. That’s where recruitment analytics comes in and where CloudApper AI Recruiter turns analytics from a reporting exercise into a practical, everyday capability.

You’re probably sitting on a goldmine of hiring data right now. Every application, every interview, every hire tells you something important about what’s working and what isn’t. But if you’re not measuring it, you can’t improve it.
In this guide, I’ll walk you through what recruitment analytics actually is, which metrics matter most, how to build a dashboard that people will actually use, and how AI makes analytics easier and more accurate. By the end, you’ll know exactly how to turn your recruitment process from guesswork into a science.
What is Recruitment Analytics?
Let’s start simple. Recruitment analytics is the process of collecting, measuring, and analyzing hiring data to improve recruitment outcomes and make evidence-based talent acquisition decisions. Instead of hoping you’re going the right direction, you actually know where you are and where you need to go.
Here’s why this matters to you. When you use recruitment analytics properly, you can dramatically reduce your time-to-hire. You’ll lower your cost-per-hire because you’re not wasting money on job boards that don’t work. You’ll improve your quality of hire because you’re making decisions based on what actually predicts success in your company, not just what feels right. And you’ll increase diversity and reduce bias because you can see exactly where certain candidates are dropping out of your process.
Essential Recruitment Metrics to Track
You can measure hundreds of things in recruitment. But you shouldn’t. Here are the recruitment metrics that will actually change how you hire.
Time and Efficiency Metrics
Time-to-Hire measures the days from when a candidate applies to when they accept your offer. It matters because in today’s competitive market, speed wins. If your process takes 30 days and your competitor takes 10, guess who gets the best candidates?
See how AI can help you reduce time-to-hire without sacrificing quality.
Time-to-Fill is slightly different. It measures days from when you post the job to when someone accepts the offer. Use this metric when you’re trying to understand your entire recruitment cycle, including how long it takes to write job descriptions and get approvals. Most industries average 30-45 days, but this varies wildly depending on the role.
Application Completion Rate reveals a painful truth: 92% of candidates who start your application don’t finish it. For every 100 people who click “Apply Now,” only 8 actually submit. Why? Because your application process is probably too long and too complicated. Track this metric to identify where candidates are dropping off and simplify those steps.
Quality Metrics
Quality of Hire is the holy grail metric, but also the hardest to measure. Here’s a simple formula: take the average of your new hire’s performance rating (after 6-12 months), their retention rate (are they still there?), and their hiring manager’s satisfaction score. Divide by 3.
It’s a lagging indicator, meaning you won’t know if you made a good hire for months. But it’s the most important number because it tells you if your entire process is working.
Read my practical guide to achieving quality hires in high-volume recruitment.
Offer Acceptance Rate should be around 85-90%. If yours is lower, something’s wrong. Maybe your salary isn’t competitive. Maybe candidates are having a bad experience in your process. Maybe you’re taking so long that people move on.
Track this by source, too. You might find that candidates from employee referrals accept 95% of the time, while candidates from a particular job board only accept 60%. That tells you something about quality and fit.
Source of Hire Quality is crucial. Don’t just track where hires come from. Track how well they perform. You might be spending thousands on a job board that gives you lots of applicants, but if none of them turn into good employees, why are you still using it?
Cost Metrics
Cost-per-Hire is straightforward. Add up everything you spend on recruitment (internal costs like recruiter salaries and external costs like job board subscriptions and agency fees), then divide by your total number of hires. The industry average cost-per-hire is $4,000-$5,000 per hire. If yours is significantly higher, look for inefficiencies in your process.
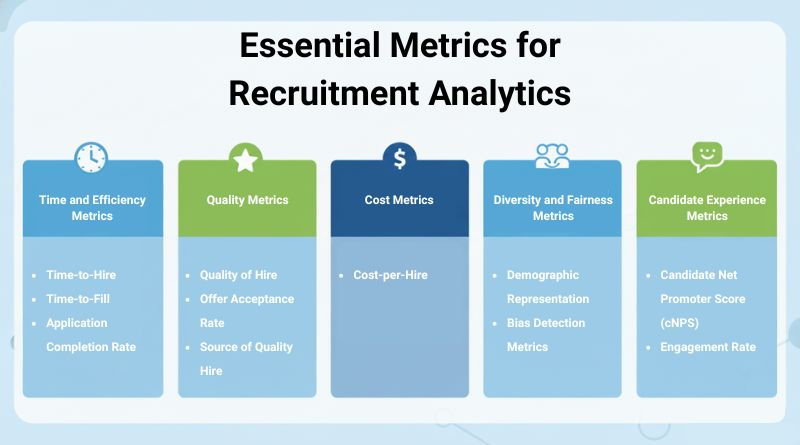
Diversity and Fairness Metrics
Demographic Representation should be tracked at each stage of your funnel: who applies, who gets screened in, who gets interviewed, who gets offers, and who accepts. This shows you exactly where diverse candidates are dropping out.
Maybe you’re getting diverse applicants, but they’re being screened out at higher rates. That’s a bias problem. Maybe you’re making diverse offers, but they’re not accepting. That’s potentially a culture or compensation problem.
Bias Detection Metrics look at your screen-out rates by demographic group. If you’re screening out women at twice the rate of men, even after controlling for qualifications, you have bias in your process. It might be unconscious human bias. It might be algorithmic bias from AI tools. Either way, you need to fix it, and this way you can actually reduce hiring bias.
Candidate Experience Metrics
Candidate Net Promoter Score (cNPS) asks one simple question: “Would you recommend applying here to a friend?” Answers range from 0-10. Scores of 9-10 are promoters. Scores of 0-6 are detractors. Subtract the percentage of detractors from the percentage of promoters, and that’s your cNPS. A score between +10 and +30 is good. Above +30 is excellent.
Engagement Rate tracks how many candidates open your emails, respond to your messages, and complete each stage of your application. Low engagement means either your process is too slow, too complicated, or your communication isn’t resonating.
Building an Effective Recruitment Analytics Dashboard
Having metrics is useless if nobody looks at them. That’s why your dashboard design matters.
Essential Dashboard Components
Real-Time Metrics Overview should be your home screen. You need to see your pipeline status at a glance. How many active jobs do you have? How many candidates are at each stage? Where are the bottlenecks?
The key word is “real-time.” If you’re looking at data from last week, you’re already behind. Your dashboard should update continuously as candidates move through your process.
Funnel Analysis creates a visual showing: Applied, Screened, Interviewed, Offered, Hired. Look at the conversion rate between each stage. If 100 people apply but only 5 get screened in, maybe your job description is attracting the wrong people. If 20 people get interviewed but only 1 gets an offer, maybe your screening isn’t working.
Explore how a well-designed recruitment funnel improves hiring outcomes.
Comparative Analytics lets you compare candidates side-by-side. You need to see scores, notes from interviews, and how each person stacks up against your requirements. This makes decision-making faster and more consistent.
You also want to filter by department, role type, or hiring manager. Maybe your engineering team is crushing it with a 15-day time-to-hire, but your sales team is averaging 45 days. That tells you where to focus your improvement efforts.
Performance Tracking shows trends over time. Is your time-to-hire improving or getting worse? Are you hitting your diversity goals? Is cost-per-hire going up or down? Weekly and monthly trend lines help you see if your changes are actually working.
Dashboard Best Practices
Mobile accessibility is non-negotiable. Hiring managers need to review candidates on their phone between meetings. Executives want to check metrics on the weekend without opening their laptops.
Automated report generation saves hours. Instead of manually compiling numbers for your monthly leadership meeting, the system should generate a polished report automatically.
Integration with your existing ATS and HRIS is critical. You don’t want to manually export data and build dashboards in Excel. The whole point is automation. Look for analytics solutions that connect seamlessly with your current systems.
How CloudApper AI Recruiter Transforms Recruitment Analytics
Let’s talk about what makes CloudApper’s approach to recruitment analytics different. These aren’t theoretical benefits. These are real improvements I’ve seen with teams using the platform.
Multi-Agent AI Architecture for Comprehensive Analytics
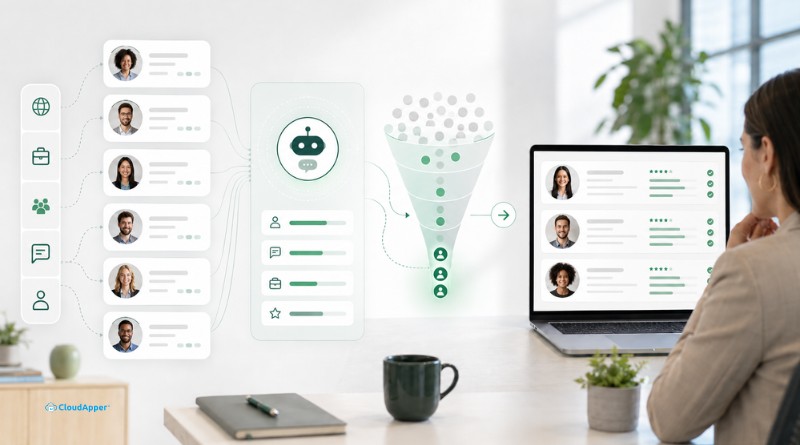
CloudApper uses specialized AI agents that work together to give you complete visibility into your recruitment process. The Analytics Agent provides real-time insights and dashboards. The Screening Agent analyzes every resume and generates candidate scoring data. The Assessment Agent evaluates candidate fit through intelligent questioning. The Communication Agent tracks every email and text interaction. The Scheduling Agent monitors interview coordination efficiency. All of this data flows into one consolidated view, so you’re not jumping between systems or manually compiling reports.
Automated Data Collection Without Manual Work
In traditional recruitment, someone has to manually track everything—a recruiter reviews a resume and updates a spreadsheet, an interview happens, and someone logs the outcome. CloudApper captures everything automatically. Every resume gets analyzed by the Screening Agent, every candidate interaction gets logged by the Communication Agent, and every scheduling event gets tracked. Your dashboard updates in real-time with no human effort required, and you get instant alerts when something looks wrong, like candidates dropping out at unusual rates or job postings getting clicks but few applications.
Seamless Integration with Your Existing Systems
CloudApper works with your existing ATS and HRIS without forcing you to migrate or change your workflow. Whether you use SAP SuccessFactors, Workday, Greenhouse, Oracle, Lever, UKG, BambooHR, or other major platforms, CloudApper integrates seamlessly. Your recruitment analytics pull from all these systems automatically—you’re not manually exporting data or maintaining separate databases—and the multi-agent AI connects to your tech stack to create a unified analytics view without disrupting how your team already works.
If you’re already collecting hiring data but still don’t have clear answers, the problem isn’t effort; it’s visibility.
What Recruitment Analytics Looks Like Before and After CloudApper AI Recruiter
It’s one thing to understand how CloudApper AI Recruiter works in theory. It’s another to see how it changes recruitment analytics in day-to-day hiring. When you compare how teams typically track hiring data before using an AI-driven platform with what analytics look like once CloudApper AI Recruiter is part of the workflow, the difference is hard to miss. The table below shows how recruitment analytics shifts from manual, delayed reporting to real-time, usable insight.
| Recruitment Analytics Area | Before CloudApper AI Recruiter | After CloudApper AI Recruiter |
|---|---|---|
| Data Collection | Manual updates in spreadsheets and ATS fields; inconsistent data entry | Automatically captured from screening, messaging, assessments, and scheduling |
| Time-to-Hire Visibility | Calculated retroactively, often days or weeks later | Tracked in real time as candidates move through the funnel |
| Funnel Conversion Tracking | Partial or missing data across stages | Full-funnel visibility from application to offer acceptance |
| Source Performance Analysis | Volume-based reporting (applicants, not outcomes) | Quality-based insights tied to performance, acceptance, and retention signals |
| Candidate Engagement Metrics | Limited to email opens or anecdotal feedback | Measured across SMS, email, chat, response time, and drop-off points |
| Bias & Fairness Detection | Difficult to spot without deep manual analysis | Screen-out and progression trends visible across demographic groups |
| Reporting & Dashboards | Static reports compiled weekly or monthly | Live dashboards updated continuously with actionable insights |
| Recruiter Effort | High manual effort to maintain data accuracy | No manual tracking required—analytics update automatically |
| Decision-Making | Reactive and intuition-driven | Proactive, data-driven, and predictive |
Overcoming Common Recruitment Analytics Challenges
Implementing recruitment analytics isn’t always smooth. Here are the obstacles you’ll face and how to get past them.
Data Silos Across Systems. Your recruitment data lives everywhere: in your ATS, your HRIS, email, and individual spreadsheets. When you try to analyze anything, you’re manually pulling data from five different places. The solution is an integrated platform that connects to your existing systems and creates a single source of truth.
Poor Data Quality. Different recruiters enter data differently. Some fields are blank. Dates are inconsistent. When you try to calculate time-to-hire, half your records don’t have the timestamps you need. AI-powered automation solves this by capturing data automatically in a standardized, complete format.
Analysis Paralysis. You build a dashboard with 50 different metrics, and nobody uses it because it’s overwhelming. Start with 5-7 core metrics tied to your business goals. You can always add more later, but begin with what matters most right now.
Lack of Stakeholder Buy-In. You build beautiful dashboards and nobody looks at them. The solution is to demonstrate quick wins. Pick one metric, show how it improves an outcome people care about, and make believers. Make your dashboards visual and easy to understand. Nobody wants to read a table of numbers.
Time-Consuming Manual Tracking. If maintaining analytics takes hours every week, people will stop doing them. Look for analytics solutions that automatically collect data, update dashboards, and generate reports without manual effort.
Transform Your Hiring with Data-Driven Decisions
Recruitment analytics changes everything about how you hire. Instead of wondering if your process works, you know. Instead of making decisions based on intuition, you make them based on evidence. Instead of reacting to problems after they happen, you see them coming and fix them proactively.
Track time-to-hire, quality of hire, cost-per-hire, diversity representation, and candidate experience consistently. Build dashboards customized for different stakeholders. Use AI to automate data collection, identify patterns, detect bias, and predict outcomes.
Start small with a few key metrics, prove the value, and expand from there. The goal isn’t perfect analytics on day one. The goal is to make better hiring decisions today than you did yesterday.
CloudApper AI Recruiter’s Analytics Agent provides real-time insights and dashboards that integrate seamlessly with your existing ATS and HRIS. You get the recruitment analytics you need without disrupting your current workflow or spending hours on manual tracking.
Better hiring doesn’t come from guessing faster — it comes from seeing clearly, acting early, and improving continuously.

What is CloudApper AI Platform?
CloudApper AI is an advanced platform that enables organizations to integrate AI into their existing enterprise systems effortlessly, without the need for technical expertise, costly development, or upgrading the underlying infrastructure. By transforming legacy systems into AI-capable solutions, CloudApper allows companies to harness the power of Generative AI quickly and efficiently. This approach has been successfully implemented with leading systems like UKG, Workday, Oracle, Paradox, Amazon AWS Bedrock and can be applied across various industries, helping businesses enhance productivity, automate processes, and gain deeper insights without the usual complexities. With CloudApper AI, you can start experiencing the transformative benefits of AI today. Learn More
- Useful Links:
- Agentic AI
- No-Code/Low-Code
- Custom Software
- WorkBridge
- iPaaS
- FedRAMP
CloudApper AI Solutions for HR

- Works with


- and more.







Similar Posts
The 7-Second Resume Rule Is Killing High-Volume Hiring in Dayforce:…
How to Automatically Feed Candidate Scores in Greenhouse Scorecards