Most enterprise build estimates cover only one-third of what an internal application actually costs over four years. Maintenance, compliance overhead, DevOps burden, and institutional knowledge risk accumulate invisibly after launch. Here's the full lifecycle math — and why platform-based development changes the economics.

Table of Contents
- What the Build Estimate Actually Measures
- Compliance Overhead as a Cost Category
- The Institutional Knowledge Problem, Priced
- DevOps Overhead: The Infrastructure Tax
- The Technical Debt Accumulation Rate
- What the Platform Math Actually Looks Like
- Running the Comparison Honestly
Here’s the number that keeps appearing in budget conversations: the cost to build an internal application. Development hours multiplied by blended rate. Infrastructure. Testing. Maybe some design. A contingency buffer. The figure lands in a slide deck, gets approved or negotiated, and becomes the baseline against which the project is later measured.

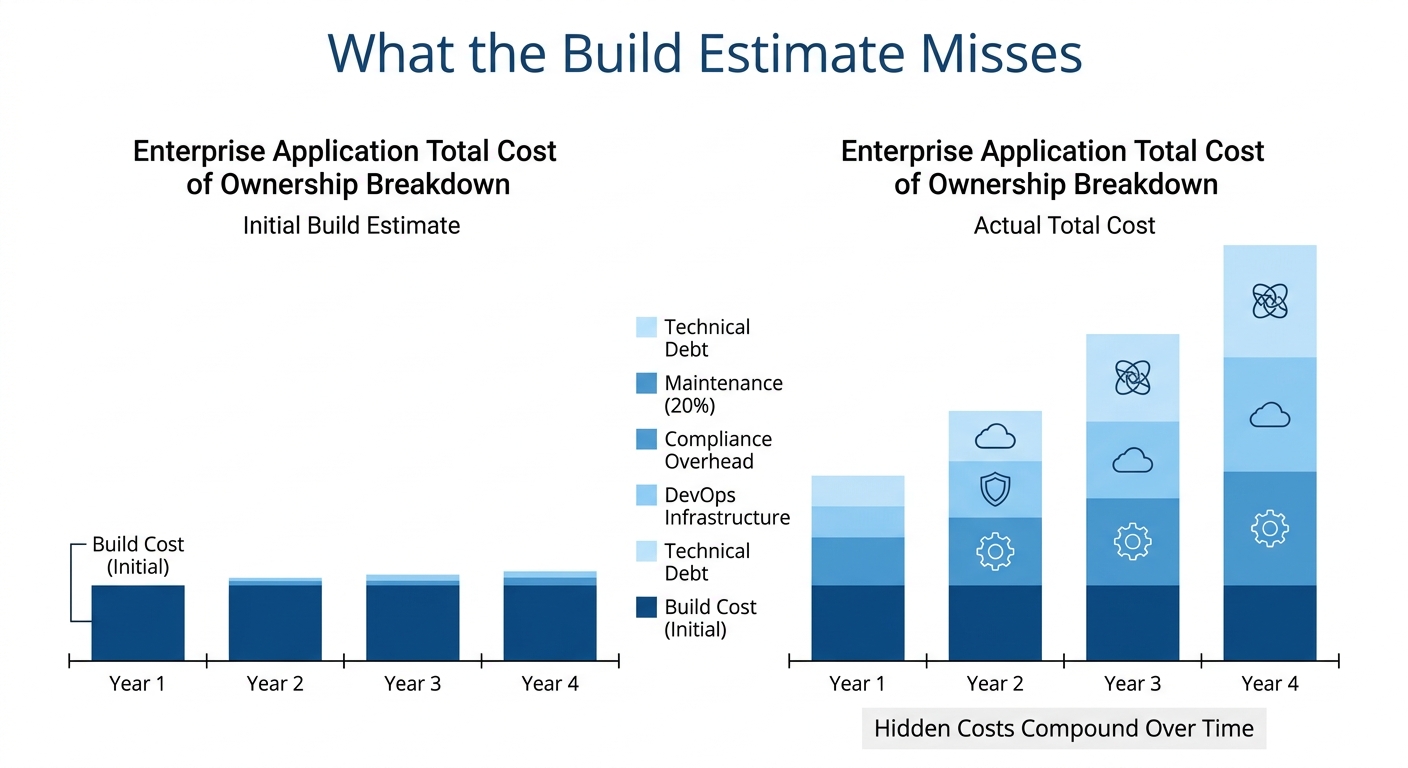
That number is accurate. It is also, for most organizations running custom internal development, approximately one-third of what the application will cost over a four-year lifecycle.
The other two-thirds don’t appear in the build estimate because they don’t exist yet when the project is scoped. They accumulate slowly: maintenance cycles, compliance reviews, infrastructure management, security audits, developer turnover, documentation debt, and the quiet cost of applications that become production-critical before anyone has thought carefully about what happens when the person who built them leaves. By the time these costs are visible, they’re embedded in operational budgets with no clear attribution to the application that generated them.
This is the core problem with how enterprises account for internal application development. The build decision gets made on build-phase economics. The lifetime economics look substantially different — and for most organizations, the gap between what they expected to spend and what they actually spend is where platform-based development approaches start to make financial sense, not just operational sense.
CloudApper surfaces this dynamic in nearly every engagement with enterprise IT teams evaluating their current development approach. The build estimate looks manageable. The total cost of ownership conversation changes the math.
What the Build Estimate Actually Measures
A typical internal application build estimate captures the work required to get something from requirements to production. That’s a meaningful cost category — often the largest single line item in the project budget. But it’s also the category where the most visible, most directly attributable spending occurs. Development hours are tracked. Infrastructure provisioning is invoiced. Testing cycles are scheduled.
The problem isn’t the accuracy of these estimates within their scope. The problem is the scope itself. A build estimate is a snapshot of phase-one costs. Internal application development isn’t a phase-one problem.
Industry benchmarks for software maintenance consistently land in the range of 15–25% of the original build cost per year, depending on application complexity, integration dependencies, and the team maintaining it. For a custom application that cost $200,000 to build, that’s $30,000–$50,000 in annual maintenance overhead — bug fixes, dependency updates, integration changes when connected systems are updated, minor feature additions, and performance work. That figure compounds. Over four years, a single application that cost $200,000 to build has accumulated $120,000–$200,000 in maintenance costs before the conversation about whether to replace or rebuild it even begins.
Most organizations don’t track maintenance cost at the application level. It gets absorbed into team operational budgets, attributed to general engineering work, or simply becomes invisible as the people involved shift between projects. The application that cost $200,000 to build never gets a line item that says “four-year lifecycle cost: $400,000.” But that’s the economics that actually determine whether it was the right investment.
Compliance Overhead as a Cost Category
For organizations operating in regulated environments — healthcare, financial services, retail with PCI exposure, any industry with SOC 2 obligations — each custom application that enters production creates a compliance surface that requires ongoing management. This is a cost category that almost never appears in internal application build estimates because it’s not owned by the development team. It’s owned by compliance, security, or audit functions that track it separately. But the underlying driver is the same: every custom application the team builds is an application that compliance has to account for.
SOC 2 auditors increasingly focus on internal application development practices — not just the existence of policy documents, but evidence that secure development lifecycles were followed for every application in scope. For a team managing a portfolio of twenty custom applications, satisfying those evidence requirements is a non-trivial annual undertaking: development process documentation, code review records, vulnerability scan results, penetration testing reports, remediation tracking. The staff time required to maintain and present this documentation is real, even if it doesn’t appear in any project budget.
Per-application compliance overhead in regulated environments typically runs $15,000–$40,000 annually depending on the compliance frameworks in scope and the complexity of the application’s data environment. For organizations managing large custom application portfolios, this aggregates quickly. A portfolio of fifteen custom applications, each generating $25,000 in annual compliance overhead, represents $375,000 per year in cost that exists nowhere in any original build estimate.
The Institutional Knowledge Problem, Priced
The institutional knowledge concentration that custom development creates is a well-documented operational risk. It’s less commonly treated as a cost category, even though it generates real, quantifiable expenses when it manifests.
When a developer who built or maintained a critical internal application leaves the organization, the cost appears in several places: recruitment and onboarding for the replacement, the productivity gap during ramp-up, and the specific cost of reverse-engineering or relearning the applications the departing developer understood. For applications with no current documentation, that last cost is often the largest — hours of developer time spent understanding what something does before anyone can safely modify or support it.
For a three-to-five-person internal development team, turnover at industry-average rates generates this cost cycle continuously. It’s not an exceptional event — it’s a structural feature of custom development that never appears in any TCO analysis. The build estimate assumed the developers who built the system would be there to maintain it. The actual economics don’t support that assumption.
DevOps Overhead: The Infrastructure Tax
Infrastructure management overhead is another cost category that build estimates consistently underrepresent. Provisioning a cloud environment for an internal application is a project cost. Patching it, monitoring it, managing certificates, handling runtime failures, and keeping it current through cloud provider updates is an ongoing operational cost. For small internal development teams, this overhead is often the single largest consumer of developer time that isn’t new development.
Data on the distribution of developer time in custom application environments consistently shows that 30–40% of engineering capacity in mature custom app portfolios is consumed by operations and maintenance work rather than new development. That allocation is invisible in build estimates because it hasn’t happened yet when the project is scoped. By the time it’s visible, it’s expressed as a backlog problem: the team can’t get to new projects because they’re too busy maintaining existing ones.
CloudApper’s zero-DevOps architecture removes this overhead category from the equation. When the platform manages runtime, patching, updates, and infrastructure, development capacity isn’t progressively consumed by the operational burden of the portfolio it has already shipped. That reallocation of engineering time is one of the mechanisms by which a small team on a governed platform can maintain significantly more applications than the same team in a custom development environment.
The Technical Debt Accumulation Rate
Technical debt in custom application portfolios accumulates at a rate most organizations don’t attempt to measure until it becomes critical. Every application built under time pressure carries architectural shortcuts that complicate future modification. Every application built without documentation carries knowledge debt. Every application built with AI coding tools without a formal review process carries potential security debt that may not manifest until an audit or an incident surfaces it.
AI-generated code is fast to produce but expensive to trust, and the trust-building overhead — security review, vulnerability scanning, penetration testing — falls on the same development team that’s already managing the maintenance burden of the existing portfolio. Every application that gets built faster with an AI coding tool still needs to be reviewed and validated. The acceleration at build time doesn’t reduce the overhead at every subsequent stage. What it often does is increase the rate at which untested code enters production, which accelerates technical debt accumulation across the portfolio.
What the Platform Math Actually Looks Like
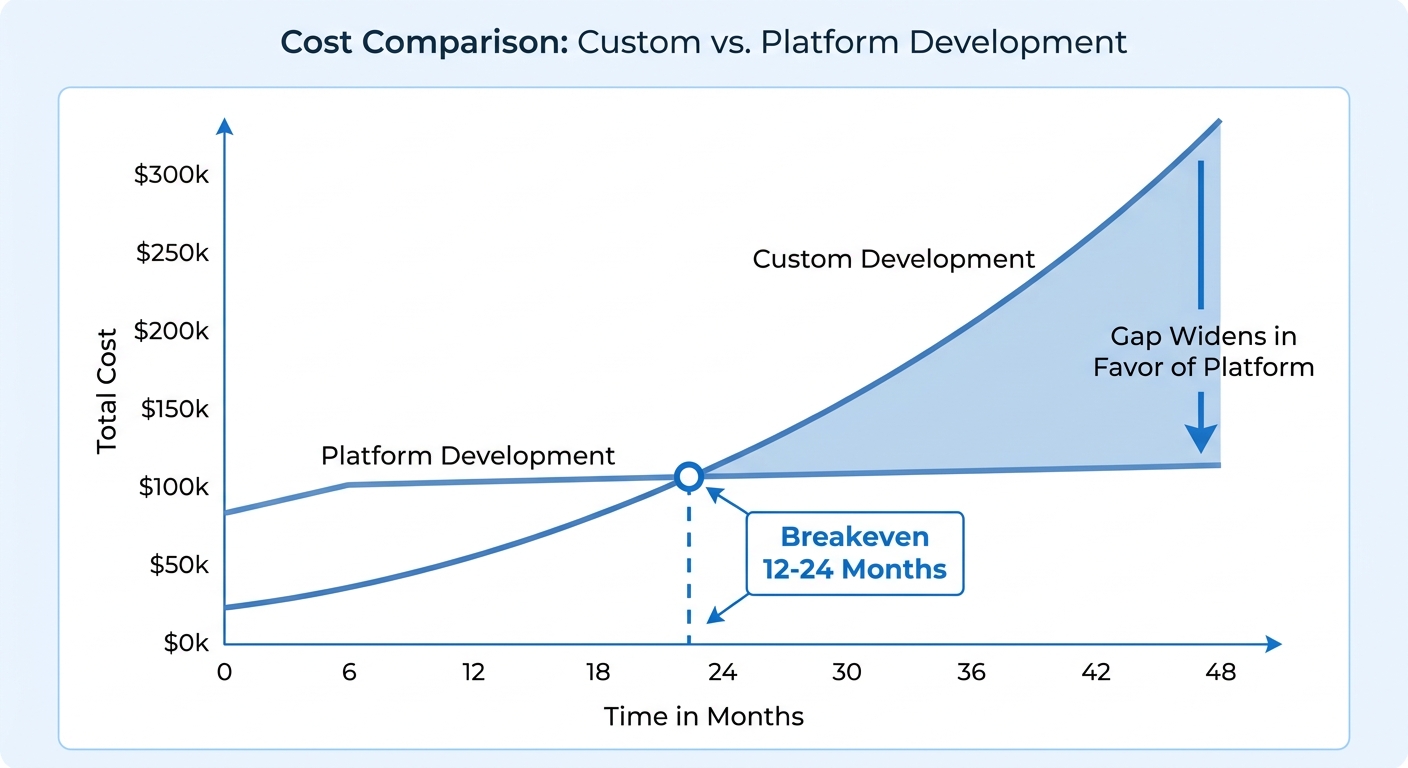
The economics of platform-based development look different at the build phase and at the lifecycle phase. At the build phase, a governed enterprise platform like CloudApper often carries a higher apparent cost than a custom build using internal development resources. This is the comparison that tends to dominate budget conversations, because it’s the comparison that happens before the application exists and the lifecycle costs begin.
At the lifecycle phase, the comparison reverses. A custom application’s total cost of ownership includes its share of maintenance overhead, compliance review, DevOps burden, institutional knowledge risk, and technical debt accumulation. A platform-built application inherits compliance posture from the platform, runs on infrastructure the platform manages, and doesn’t create unique maintenance obligations that depend on the developer who built it. The per-application overhead is substantially lower because the platform absorbs the overhead categories that would otherwise require dedicated developer time.
The build vs. platform decision for internal enterprise applications looks fundamentally different when it’s made on lifecycle economics rather than build-phase economics. Organizations that have run this analysis honestly — accounting for maintenance, compliance, DevOps, and turnover costs across a multi-year portfolio — typically find that the breakeven point for platform-based development falls somewhere in the twelve-to-twenty-four-month range. Before that horizon, custom build looks cheaper. After it, the cumulative overhead of custom development has closed the gap and often inverted it.
Running the Comparison Honestly
The practical challenge is that most organizations don’t have the data to run this comparison with precision. Maintenance costs are absorbed into team budgets. Compliance overhead is owned by a different function. DevOps work is attributed to general operations. The application-level TCO calculation requires pulling cost data from sources that were never designed to track it at the application level.
What most IT leaders can do practically is estimate. Take the build cost for any custom application the team has shipped in the past two years. Apply a 20% annual maintenance rate. Add a per-application compliance overhead estimate based on the organization’s regulatory environment. Estimate the DevOps allocation for the portfolio as a percentage of developer capacity. Calculate the cumulative cost over three years. Then compare that to what a governed platform approach would have cost for the same application — including the platform subscription, any configuration work, and the ongoing per-application cost of an application that inherits compliance and runs on managed infrastructure.
Organizations that have run this calculation consistently find that the gap between perceived build cost and actual lifecycle cost is larger than the organization assumed when the build decision was made. That gap is where platform-based development earns its economics — not by being cheaper to start, but by being significantly less expensive to sustain across the portfolio.
CloudApper works with enterprise IT teams to run exactly this analysis: mapping the real cost structure of their existing custom application portfolio against what a governed platform approach would look like for the same scope of work. For most organizations with active internal development programs, the number that comes out of that analysis is different from the number that went into the original build decision. Often significantly different.
The question the CFO is actually asking — what does this cost? — deserves a complete answer. Not just what it costs to build, but what it costs to run, maintain, secure, and own for the four years after it ships. That’s the number the build estimate doesn’t include. And it’s the number that determines whether the investment made sense.
CloudApper works with enterprise IT teams to assess the full lifecycle economics of their internal application portfolio and model what a governed platform approach would change. If your organization is making build decisions on build-phase estimates without a clear picture of lifecycle costs, reach out to start the conversation.

What is CloudApper AI Platform?
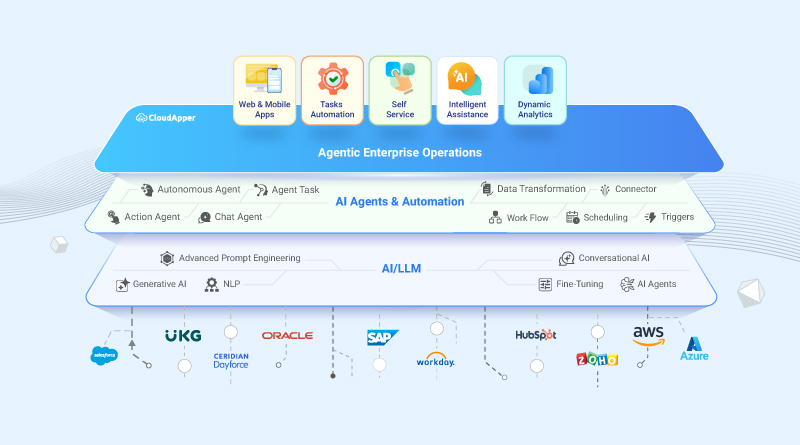
CloudApper AI is an advanced platform that enables organizations to integrate AI into their existing enterprise systems effortlessly, without the need for technical expertise, costly development, or upgrading the underlying infrastructure. By transforming legacy systems into AI-capable solutions, CloudApper allows companies to harness the power of Generative AI quickly and efficiently. This approach has been successfully implemented with leading systems like UKG, Workday, Oracle, Paradox, Amazon AWS Bedrock and can be applied across various industries, helping businesses enhance productivity, automate processes, and gain deeper insights without the usual complexities. With CloudApper AI, you can start experiencing the transformative benefits of AI today. Learn More
- Useful Links:
- Agentic AI
- No-Code/Low-Code
- Custom Software
- HCM Personalization
- iPaaS
- FedRAMP
CloudApper AI Solutions


- Works with







- and more.
Similar Posts

Microsoft Access Modernization: Why the Technical Migration Is the Easy…

When the ISV Disappears: Managing an Orphaned Windows Application With…